Download code from GitHub
Chapter 1: Introduction to the Elastic Stack
Welcome to Getting Started with Elastic Stack 8.0. The Elastic Stack has exploded in popularity over the last couple of years, becoming the de facto standard for centralized logging and "big data"-related use cases. The stack is leveraged by organizations, both big and small, across the world to solve a range of data-related problems. Hunting for adversaries in your network, looking for fraudulent transactions, real-time monitoring and alerting in systems, and searching for relevant products in catalogs are some of the real-world applications of the Elastic Stack.
The Elastic Stack is a bundle of multiple core products that integrate with each other. We will look at each product briefly in this chapter, and then dive into each one in later chapters in this book. The Elastic Stack attracts a great deal of interest from developers and architects that are working for organizations of all sizes. This book aims to serve as the go-to guide for those looking to get started with the best practices when it comes to building real-world search, security, and observability platforms using this technology.
In this chapter, you will learn a little bit about each component that makes up the Elastic Stack, and how they can be leveraged for your use cases. Those of you who are beginners or intermediary learners of this subject will benefit from this content to gain useful context for Chapter 3, Indexing and Searching for Data, to Chapter 13, Architecting Workloads on the Elastic Stack, of this book.
Specifically, we will cover the following topics:
- An overview of the Elastic Stack
- An introduction to Elasticsearch
- Visualizing and interacting with data on Kibana
- Ingesting various data sources using Logstash and Beats
- End-to-end solutions on the Elastic Stack
An overview of the Elastic Stack
The Elastic Stack is made up of four core products:
- Elasticsearch is a full-text search engine and a versatile data store. It can store and allow you to search and compute aggregations on large volumes of data quickly.
- Kibana provides a user interface for Elasticsearch. Users can search for and create visualizations, and then administer Elasticsearch, using this tool. Kibana also offers out-of-the-box solutions (in the form of apps) for use cases such as search, security, and observability.
- Beats can be used to collect and ship data directly from a range of source systems (such as different types of endpoints, network and infrastructure appliances, or cloud-based API sources) into Logstash or Elasticsearch.
- Logstash is an Extract, Transform, and Load (ETL) tool that's used to process and ingest data from various sources (such as log files on servers, Beats agents in your environment, or message queues and streaming platforms) into Elasticsearch.
This diagram shows how the core components of the Elastic Stack work together to ingest, store, and search on data:

Figure 1.1 – Components of the Elastic Stack
Each core component solves a single, common data-related problem. This genericity makes the stack flexible and domain-agnostic, allowing it to be adopted in multiple solution areas. Most users start with a simple logging use case where data is collected, parsed, and stored in Elasticsearch to create dashboards and alerts. Others might create more sophisticated capabilities, such as a workplace search to make information across a range of data sources accessible to your team; leveraging SIEM and machine learning to look for anomalous user/machine behavior and hunt for adversaries on your company network; understanding performance bottlenecks in applications; and monitoring infrastructure logs/metrics to respond to issues on critical systems.
The evolution of the Elastic Stack
Multiple independent projects have evolved over the years to create the present-day version of the Elastic Stack. Knowing how these components evolved indicates some of the functional gaps that existed in the big data space and how the Elastic Stack components come together to solve these challenges. Let's take a look:
- An open source transactional Object/Search Engine Mapping (OSEM) framework for Java called Compass was released. Compass leveraged Lucene, an open source search engine library for implementing high-performance full-text search and indexing functionality.
- To address scalability concerns in Compass, it was rewritten as a distributed search engine called Elasticsearch. Elasticsearch implemented RESTful APIs over HTTP using JSON, allowing programming languages other than Java to interact with it. Elasticsearch quickly gained popularity in the open source community.
- As Elasticsearch was adopted by the community, a modular tool called Logstash was being developed to collect, transform, and send logs to a range of target systems. Elasticsearch was one of the target systems supported by Logstash.
- Kibana was written to act as a user interface for using the REST APIs on Elasticsearch to search for and visualize data. Elasticsearch, Logstash, and Kibana were commonly referred to as the ELK Stack.
- Elastic started providing managed Elasticsearch clusters on the cloud. Elastic Cloud Enterprise (ECE) was offered for customers to orchestrate and manage Elasticsearch deployments on-premises or on private cloud infrastructure.
- An open source tool called Packetbeat was created to collect and ship network packet data to Elasticsearch. This later evolved into the Beats project, a collection of lightweight agents designed to collect and ship several types of data into Elasticsearch.
- Machine learning capabilities were added to Elasticsearch and Kibana to support anomaly detection use cases on data residing on Elasticsearch.
- Application Performance Monitoring (APM) capabilities were added to the Elastic Stack. The APM app on Kibana, together with the Logs, Metrics, and Uptime apps, formed the Observability solution.
- Kibana added security analytics functionality as part of the Security Information and Event Management (SIEM) app.
- A collection of proprietary features known as X-Pack was made open source under the Elastic licensing model.
- Endpoint Detection and Response (EDR) capabilities were added to the Elastic Stack. EDR and SIEM capabilities formed the Security solution.
- Out-of-the-box website, application, and content search functionality was offered as part of the Enterprise Search solution.
A note about licensing
The core components of the stack are open source software projects, licensed under a mix of the Apache 2, Elastic License version 2 (ELv2), and Server Side Public License (SSPL) licensing agreements. The LICENSE.txt file in the root of each product's GitHub repository should explain how the code is licensed.
A paid license is not required to learn about and explore the Elastic Stack features covered in this book. A trial license can be activated for full access to all the features for a limited period upon installing the software.
To focus on learning about the features and technical aspects of the product, there will be no notes on licensing implications after this section. Please refer to the Elastic Subscriptions page to understand what kind of license you might need for a production deployment of the technology:
https://www.elastic.co/subscriptions
What is Elasticsearch?
Elasticsearch is often described as a distributed search engine that can be used to search through and aggregate enormous amounts of data. Some describe Elasticsearch as an analytics engine, while others have used the term document store or NoSQL database. The reason for the wide-ranging definitions for Elasticsearch is that it is quite a flexible product. It can be used to store JSON documents, with or without a predefined schema (allowing for unstructured data); it can be used to compute aggregations on document values (to calculate metrics or group data into buckets), and it can be used to implement relevant, free text search functionality across a large corpus.
Elasticsearch builds on top of Apache Lucene, a popular and fast full-text search library for Java applications. Lucene is not distributed in any way and does not manage resources/handle requests natively. At its core, Elasticsearch abstracts away the complexities and intricacies of working directly with a library such as Lucene by providing user-friendly APIs to help index, search for, and aggregate data. It also introduces concepts such as the following:
- A method to organize and group related data as indices
- Replica shards to improve search performance and add redundancy in the case of hardware failure
- Thread pools for managing node resources while servicing several types of requests and cluster tasks
- Features such as Index Lifecycle Management (ILM) and data streams to manage the size and movement of indices on a cluster
Elasticsearch exposes RESTful APIs using JSON format, allowing for interoperability between different programming languages and technology stacks.
Elasticsearch today is a feature-rich and complex piece of software. Do not worry if you do not fully understand or appreciate some of the terms used to explain Elasticsearch. We will dive into these, as well as the features on offer, in Chapter 3, Indexing and Searching for Data.
When to use Elasticsearch
Selecting the right tool for the job is an important aspect of any project. This section describes some scenarios where Elasticsearch may be suited for use.
Ingesting, storing, and searching through large volumes of data
Elasticsearch is a horizontally scalable data store where additional nodes can easily be added to a cluster to increase the available resources. Each node can store multiple primary shards on data, and each shard can be replicated (as replica shards) on other nodes. Primary shards handle read and write requests, while replica shards only handle read requests.
The following diagram shows how primary and replica shards are distributed across Elasticsearch nodes to achieve scalable and redundant reading and writing of data:
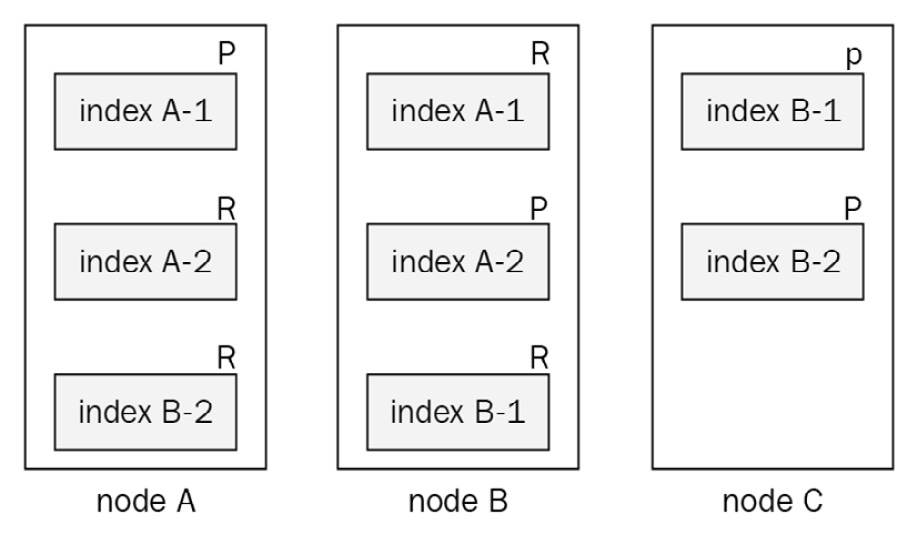
Figure 1.2 – Shards of data distributed across nodes
The preceding diagram shows the following:
- Three Elasticsearch nodes: node A, node B, and node C
- Two indices: index A and index B
- Each index with two primary and two replica shards
High volume ingest can mean either of the following things:
- A singular index or data source with a large number of events Emitted Per Second (EPS)
- A group of indices or data sources receiving a large number of aggregate events per second
Elasticsearch can also store large volumes of data for search and aggregation. To retain data costs efficiently over long retention periods, clusters can be architected with hot, warm, and cold tiers of data. During its life cycle, data can be moved across nodes with different disk or Input/Output Operations Per Second (IOPS) specifications to take advantage of slower disk drives and their associated lower costs. We will look at these sorts of architectures in Chapter 3, Indexing and Searching for Data and Chapter 13, Architecting Workloads on the Elastic Stack.
Some examples of where you need to handle large volumes of data include the following:
- Centralized logging platforms (ingesting various application, security, event, and audit logs from multiple sources)
- When handling metrics/traces/telemetry data from many devices
- When ingesting data from large document repositories or crawling a large number of web pages
Getting relevant search results from textual data
As we discussed previously, Elasticsearch leverages Lucene for indexing and searching operations. As documents are ingested into Elasticsearch, unstructured textual components from the document are analyzed to extract some structure in the form of terms. Terms are maintained in an inverted index data structure. In simple terms, an index (such as the table of contents in a book) is a list of topics (or documents) and the corresponding page numbers for each topic. An index is great for retrieving page content, given you already know what the chapter is called. An inverted index, however, is a collection of words (or terms) in topics and a corresponding list of pages that contain them. Therefore, an inverted index can make it easier to find all the relevant pages, given the search term you are interested in.
The following table visualizes an inverted index for a collection of documents containing recipes:
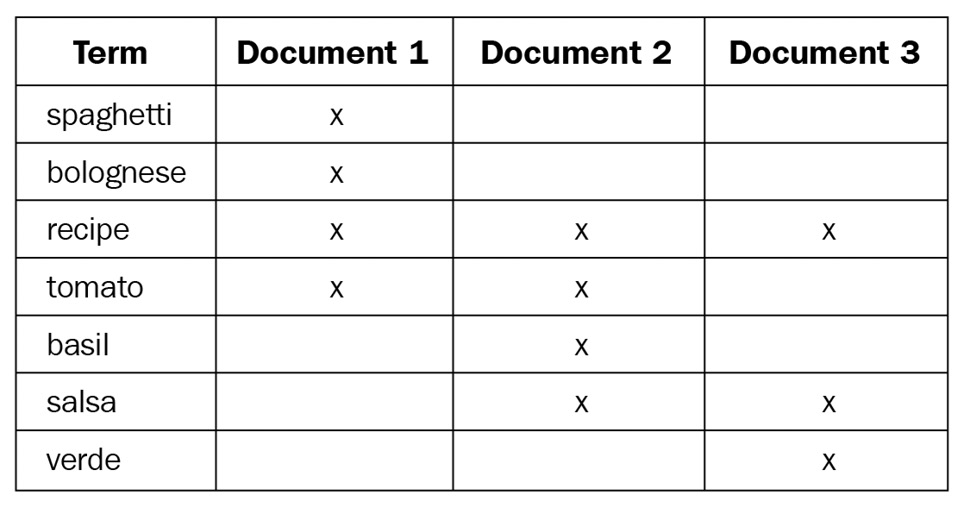
Table 1.1 – Visualization of an inverted index
A search string containing multiple terms goes through a similar process of analysis to extract terms, to then look up all the matching terms and their occurrences in the inverted index. A score is calculated for each field match based on the similarity module. By default, the BM25 ranking function (based on term frequency/inverse document frequency) is used to estimate the relevance of a document for a search query. Elasticsearch then returns a union of the results if an OR operator is used (by default) or an intersection of the results if an AND operator is used. The results are sorted by score, with the highest score appearing first.
Aggregating data
Elasticsearch can aggregate large volumes of data with speed thanks to its distributed nature. There are primarily two types of aggregations:
- Bucket aggregations: Bucket aggregations allow you to group (and sub-group) documents based on the values of fields or where the value sits in a range.
- Metrics aggregations: Metrics aggregations can calculate metrics based on the values of fields in documents. Supported metrics aggregations include
avg,min,max,count, andcardinality, among others. Metrics can be computed for buckets/groups of data.
Tools such as Kibana heavily use aggregations to visualize the data on Elasticsearch. We will dive deeper into aggregations in Chapter 4, Leveraging Insights and Managing Data on Elasticsearch.
Acting on data in near real time
One of the benefits of quickly ingesting and retrieving data is the ability to respond to the latest information quickly. Imagine a scenario where uptime information for business-critical services is ingested into Elasticsearch. Alerting would work by continually querying Elasticsearch (at a predefined interval) to return any documents that indicate degrading service performance or downtime. If the query returns any results, actions can be configured to alert a Site Reliability Engineer (SRE) or trigger automated remediation processes as appropriate.
Watcher and Kibana alerting are two ways in which this can be achieved; we will look at this in detail in Chapter 4, Leveraging Insights and Managing Data on Elasticsearch, and Chapter 8, Interacting with Your Data on Kibana.
Working with unstructured/semi-structured data
Elasticsearch does not require predefined schemas for documents you want to work with. Schemas on indices can be preconfigured if they're known to control storage/memory consumption and know how the data will be used later on. Schemas (also known as index mappings) can be dynamically or strictly configured, depending on your flexibility and the maturity of your document's structure.
By default, Elasticsearch will dynamically update these index mappings based on the documents that have been ingested. Where no mapping exists for a field, Elasticsearch will guess the data type based on its value. This flexibility makes it extremely easy for developers to get up and running, while also making it suitable for use in environments where document schemas may evolve over time.
We'll look at index mappings in Chapter 3, Indexing and Searching for Data.
Architectural characteristics of Elasticsearch
Elasticsearch can be configured to work as a distributed system where groups of nodes (Elasticsearch instances) work together to form a cluster. Clusters can be set up for the various architectural characteristics when deployed in mission-critical environments. We will take a look at some of these in this section.
Horizontally scalable
As we mentioned previously, Elasticsearch is a horizontally scalable system. Read/write throughput, as well as storage capacity, can be increased almost linearly by adding additional nodes to the Elasticsearch cluster. Adding nodes to a cluster is relatively effortless and can be done without any downtime. The cluster can automatically redistribute shards evenly across nodes (subject to shard allocation filtering rules) as the number of nodes available changes to optimize performance and improve resource utilization across nodes.
Highly available and resilient
A primary shard in Elasticsearch can handle both read and write operations, while a replica shard is a read-only copy of a primary shard. By default, Elasticsearch will allocate one replica for every primary shard on different nodes in the cluster, making Elasticsearch a highly available system where requests can still be completed when one or more nodes experience failures.
If a node holding a primary shard is lost, a replica shard will be selected and promoted to become a primary shard, and a replica shard will be allocated to another node in the cluster.
If a node holding a replica shard is lost, the replica shard will simply be allocated to another node in the cluster.
Indexing and search requests can be handled seamlessly while shards are being allocated, with clients experiencing little to no downtime. Even if a search request fails, subsequent search requests will likely succeed because of this architecture.
Shard allocation on Elasticsearch can also consider node attributes to help us make more informed allocation decisions. For example, a cluster deployed in a cloud region with three availability zones can be configured so that replicas are always allocated on a different availability zone (or even a server rack in an on-premises data center) to the primary shard to protect against failures at the zone level.
Recoverable from disasters
Elasticsearch allows us to persistently store or snapshot data, making it a recoverable system in the event of a disaster. Snapshots can be configured to write data to a traditional filesystem or an object store such as AWS S3. Snapshots are a point-in-time copy of the data and must be taken at regular intervals, depending on your Recovery Point Objective (RPO), for an effective disaster recovery plan to be created.
Cross-cluster operations
Elasticsearch can search for and replicate data across remote clusters to enable more sophisticated architectural patterns.
Cross-Cluster Search (CCS) is a feature that allows you to search data that resides on an external or remote Elasticsearch cluster. A single search request can be run on the local cluster, as well as one or more remote clusters. Each cluster will run the search independently on its own data before returning a response to the coordinator node (the node handling the search request). The coordinator nodes then combine the results from the different clusters into a single response for the client. The local node does not join remote clusters, allowing for higher network latencies for inter-cluster communication, compared to intracluster communication. This is useful in scenarios where multiple independent clusters in different geographic regions need to search on each other to have a unified search capability.
The following diagram shows how Elasticsearch clusters can search across multiple clusters and combine results into a single search response for the user:
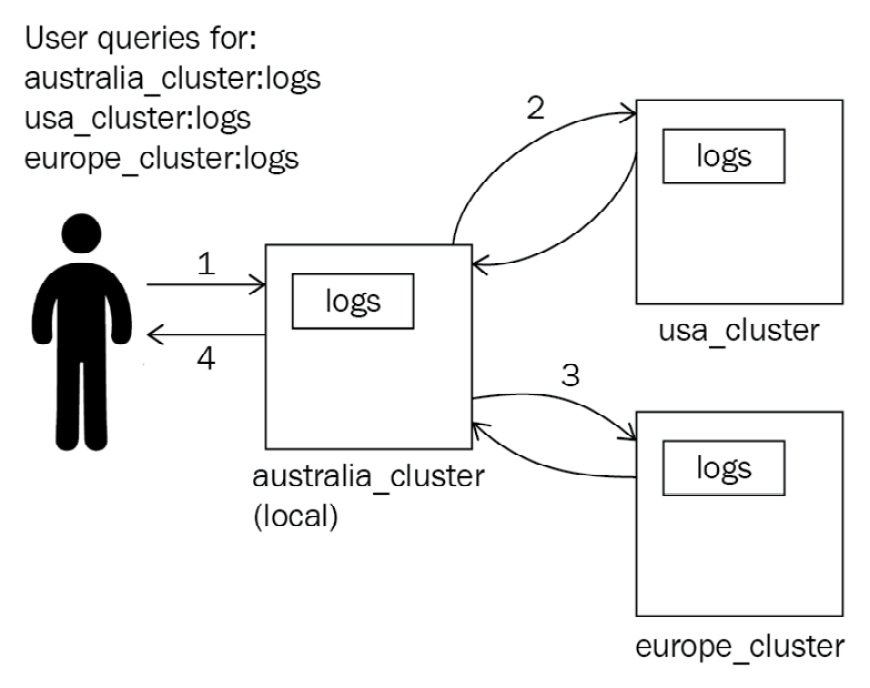
Figure 1.3 – How CCS requests are handled
Cross-cluster replication (CCR) allows an index to be replicated in a local cluster to a remote cluster. CCR implements a leader/follower model, where all the changes that have been made to a leader index are replicated on the follower index. This feature allows for fast searching on the same dataset in different geographical regions by replicating data closer to where it will be consumed. CCR is also sometimes used for cross-region redundancy requirements:

Figure 1.4 – How CCR works
CCS and CCR enable more complex use cases where multiple regional clusters can be used to independently store and search for data, while also allowing unified search and geographical redundancy.
Security
Elasticsearch offers security features to help authenticate and authorize user requests, as well as encrypting network communications to and within the cluster:
- Encryption in transit: TLS can be used to encrypt inter-node communications, as well as REST API requests.
- Access control: Role-Based Access Control (RBAC) or Attribute-Based Access Control (ABAC) can be used to control access to the data and functionality on Elasticsearch:
- RBAC works by associating a user with a role, where a role contains a list of privileges (such as read/write/update), as well as the resources these privileges can be applied to (such as an index; for example,
my-logs-1). - ABAC works by using attributes the user has (such as their location, security clearance, or job role) in conjunction with an access policy to determine what the user can do or access on the cluster. ABAC is generally a more fine-grained authorization control compared to RBAC.
- Document security: A security role in Elasticsearch can specify what subset of data a user can access on an index. A role can also specify what fields in a document a user can or cannot access. For example, an employee with security clearance of baseline can only access documents where the value of the classification field is either
UNOFFICIALorOFFICIAL. - Field security: Elasticsearch can also control what fields a user has access to as part of a document. Building on the example in the previous point, field-level security can be used so that the user can only view fields that start with the
metadata-string. - Authentication providers: In addition to local/native authentication, Elasticsearch can use external services such as Active Directory, LDAP, SAML, and Kerberos for user authentication. API keys-based authentication is also available for system accounts and programmatic access.
When Elasticsearch may not be the right tool
It is also important to understand the limitations of Elasticsearch. This section describes some scenarios where Elasticsearch alone may not be the best tool for the job.
Handling relational datasets
Elasticsearch, unlike databases such as MySQL, was not designed to handle relational data. Elasticsearch allows you to have simple relationships in your data, such as parent-child and nested relationships, at a performance cost (at search time and indexing time, respectively). Data on Elasticsearch must be de-normalized (duplicating or adding redundant fields to documents, to avoid having to join data) to improve search and indexing/update performance.
If you need to have the database manage relationships and enforce rules of consistency across different types of linked data, as well as maintaining normalized records of data, Elasticsearch may not be the right tool for the job.
Performing ACID transactions
Individual requests in Elasticsearch support ACID properties. However, Elasticsearch does not have the concept of transactions, so it does not offer ACID transactions.
At the individual request level, ACID properties can be achieved as follows:
- Atomicity is achieved by sending a write request, which will either succeed on all active shards or fail. There is no way for the request to partially succeed.
- Consistency is achieved by writing to the primary shard. Data replication happens synchronously before a success response is returned. This means that all the read requests on all shards after a write request will see the same response.
- Isolation is offered since concurrent writes or updates (which are deletes and writes) can be handled successfully without any interference.
- Durability is achieved since once a document is written into Elasticsearch, it will persist, even in the case of a system failure. Writes on Elasticsearch are not immediately persisted onto Lucene segments on disk as Lucene commits are relatively expensive operations. Instead, documents are written to a transaction log (referred to as a translog) and flushed into the disk periodically. If a node crashes before the data is flushed, operations from the translog will be recovered into the Lucene index upon startup.
If ACID transactions are important to your use case, Elasticsearch may not be suitable for you.
Important Note
In the case of relational data or ACID transaction requirements, Elasticsearch is often used alongside a traditional RDBMS solution such as MySQL. In such architectures, the RDBMS would act as the source of truth and handle writes/updates from the application. These updates can then be replicated to Elasticsearch using tools such as Logstash for fast/relevant searches and visualization/analytics use cases.
With that, we have explored some of the core concepts of Elasticsearch and the role it plays in ingesting and storing our data. Now, let's look at how we can interact with the data on Elasticsearch using Kibana.
Introducing Kibana
Kibana was created primarily as a visualization tool for data residing on Elasticsearch and is bundled together as part of the stack. Since its inception, Kibana has evolved to cater to use cases such as alerting, reporting, and monitoring Elastic Stack components, as well as administrating and managing the Elasticsearch cluster in use.
More importantly, Kibana provides the interface and functionality for the solutions that Elastic Stack offers, in addition to administration and management options for the core components. Functionality in Kibana is organized using applications (or apps, for short).
Apps on Kibana can be solution-specific or part of the general stack. The SIEM app, for example, powers the security solution, enabling security analysts and threat hunters to defend their organization from attacks. The APM app is another solution-specific app that, in this case, allows developers and SREs to observe their applications to look for issues or performance bottlenecks.
On the other hand, general Kibana apps such as Discover, Visualize, and Dashboard can be used to explore, interrogate, and visualize data, regardless of the solution the data enables. Ingest Manager is another example of an app that allows you to configure Elastic Agent to collect any kind of data from across an environment, agnostic of the solution the data may be used in.
Solution-specific apps on Kibana provide a great out-of-the-box user experience, as well as targeted features and functionality for the solution in question. General or stack-based applications provide powerful but unified capabilities that can be used across all solutions, even custom solutions that you might build on the Elastic Stack. General Kibana apps such as Discover and Dashboard are useful for all use cases, while solution-specific apps such as Observability and Security provide curated out-of-the-box experiences for the solution area. Kibana is usually considered a core component of the Elastic Stack and is often installed, even if the cluster is not used for data analysis.
We will dive deeper into Kibana's features in Chapter 8, Interacting with Your Data on Kibana. Now, let's look at how data can be collected and ingested into Elasticsearch using Logstash and Beats.
Collecting and ingesting data
So far, we have looked at Elasticsearch, a scalable search and analytics engine for all kinds of data. We have also got Kibana to interface with Elasticsearch to help us explore and use our data effectively. The final capability to make it all work together is ingestion.
The Elastic Stack provides two products for ingestion, depending on your use cases.
Collecting data from across your environment using Beats
Useful data is generated all over the place in present-day environments, often from varying technology stacks, as well as legacy and new systems. As such, it makes sense to collect data directly from, or closer to, the source system and ship it into your centralized logging or analytics platform. This is where Beats come in; Beats are lightweight applications (also referred to as agents) that can collect and ship several types of data to destinations such as Elasticsearch, Logstash, or Kafka.
Elastic offers a few types of Beats today for various use cases:
- Filebeat: Collecting log data
- Metricbeat: Collecting metric data
- Packetbeat: Decoding and collecting network packet metadata
- Heartbeat: Collecting system/service uptime and latency data
- Auditbeat: Collecting OS audit data
- Winlogbeat: Collecting Windows event, applicatio, and security logs
- Functionbeat: Running data collection on serverless compute infrastructure such as AWS Lambda
Beats use an open source library called libbeat that provides generic APIs for configuring inputs and destinations for data output. Beats implement the data collection functionality that's specific to the type of data (such as logs and metrics) that they collect. A range of community-developed Beats are available, in addition to the officially produced Beats agents.
Beats modules and the Elastic Common Schema
The modules that are available in Beats allow you to collect consistent datasets and the distribution of out-of-the-box dashboards, machine learning jobs, and alerts for users to leverage in their use cases.
Importance of a unified data model
One of the most important aspects of ingesting data into a centralized logging platform is paying attention to the data format in use. A Unified Data Model (UDM) is an especially useful tool to have, ensuring data can be easily consumed by end users once ingested into a logging platform. Enterprises typically follow a mixture of two approaches to ensure the log data complies with their unified data model:
- Enforcing a logging standard or specification for log-producing applications in the company.
This approach is often considerably costly to implement, maintain, and scale. Changes in the log schema at the source can also have unintended downstream implications in other applications consuming the data. It is common to see UDMs evolve quite rapidly as the nature and the content of the logs that have been collected change. The use of different technology stacks or frameworks in an organization can also make it challenging to log with consistency and uniformity across the environment.
- Transforming/renaming fields in incoming data using an ETL tool such as Logstash to comply with the UDM. Organizations can achieve relatively successful results using this approach, with considerably fewer upfront costs when reworking logging formats and schemas. However, the approach does come with some downsides:
(a) Parsers need to be maintained and constantly updated to make sure the logs are extracted and stored correctly.
(b) Most of the parsing work usually needs to be done (or overlooked) by a central function in the organization (because of the centralized nature of the transformation), rather than by following a self-service or DevOps-style operating model.
Elastic Common Schema
The Elastic Common Schema (ECS) is a unified data model set by Elastic. The following ECS specifications have a few advantages over a custom or internal UDM:
- ECS sets Elasticsearch index mappings for fields. This is important so that metric aggregations and ranges can be applied properly to data. Numeric fields such as the number of bytes received as part of a network request should be mapped as an integer value. This allows a visualization to sum the total number of bytes received over a certain period. Similarly, the HTTP status code field needs to be mapped as a keyword so that a visualization can count how many 500 errors the application encountered.
- Out-of-the-box content such as dashboards, visualizations, machine learning jobs, and alerts can be used if your data is ECS-compliant. Similarly, you can consume content from and share it with the open source community.
- You can still add your own custom or internal fields to ECS by following the naming conventions that have been defined as part of the ECS specification. You do not have to use just the fields that are part of the ECS specification.
Beats modules
Beats modules can automatically convert logs and metrics from various supported data sources into an ECS-compliant schema. Beats modules also ship with out-of-the-box dashboards, machine learning jobs, and alerts. This makes it incredibly easy to onboard a new data source onto Elasticsearch using a Beat, and immediately being able to consume this data as part of a value-adding use case in your organization. There is a growing list of supported Filebeat and Metricbeat modules available on the Elastic integration catalog.
Onboarding and managing data sources at scale
Managing a range of Beats agents can come with significant administrative overhead, especially in large and complex environments. Onboarding new data sources would require updating configuration files, which then need to be deployed on the right host machine.
Elastic Agent is a single, unified agent that can be used to collect logs, metrics, and uptime data from your environment. Elastic Agent orchestrates the core Beats agents under the hood but simplifies the deployment and configuration process, given teams now need to manage just one agent.
Elastic Agent can also work with a component called Fleet Server to simplify the ongoing management of the agents and the data they collect. Fleet can be used to centrally push policies to control data collection and manage agent version upgrades, without any additional administrative effort. We take look at Elastic Agent in more detail in Chapter 9, Managing Data Onboarding with Elastic Agent.
Centralized extraction and transformation and loading your data with Logstash
While Beats make it very convenient to onboard a new data source, they are designed to be lightweight in terms of performance footprint. As such, Beats do not provide a great deal of heavy processing, transformation, and enrichment capabilities. This is where Logstash comes in to help your ingestion architecture.
Logstash is a general-purpose ETL tool designed to input data from any number of source systems/communication protocols. The data is then processed through a set of filters, where you can mutate, add, enrich, or remove fields as required. Finally, events can be sent to several destination systems. This configuration is defined as a Logstash parser. We will dive deeper into Logstash and how it can be used for various ETL use cases in Chapter 7, Using Logstash to Extract, Transform, and Load Data.
Deciding between using Beats and Logstash
Beats and Logstash are designed to serve specific requirements when collecting and ingesting data. Users are often confused when deciding between Beats or Logstash when onboarding a new data source. The following list aims to make this clearer.
When to use Beats
Beats should be used when the following points apply to your use case:
- When you need to collect data from a large number of hosts or systems from across your environment. Some examples are as follows:
(a) Collecting web logs from a dynamic group of hundreds of web servers
(b) Collecting logs from a large number of microservices running on a container orchestration platform such as Kubernetes
(c) Collecting metrics from a group of MySQL instances in cloud/on-premises locations
- When there is a supported Beats module available.
- When you do not need to perform a significant amount of transformation/processing before consuming data on Elasticsearch.
- When consuming from a web source, you do not need to have scaling/throughput concerns in place for a single beat instance.
When to use Logstash
Logstash should be used when you have the following requirements:
- When a large amount of data is consumed from a centralized location (such as a file share, AWS S3, Kafka, and AWS Kinesis) and you need to be able to scale ingestion throughput.
- When you need to transform data considerably or parse complex schemas/codecs, especially using regular expressions or Grok.
- When you need to be able to load balance ingestion across multiple Logstash instances.
- When a supported Beats module is not available.
It is worth noting that Beats agents are continually updated and enhanced with every release. The gap between the capabilities of Logstash and Beats has closed considerably over the last few releases.
Using Beats and Logstash together
It is quite common for organizations to get the best of both worlds by leveraging Beats and Logstash together. This allows data to be collected from a range of sources while enabling centralized processing and transformation of events.
Now that we understand how we can ingest data into the Elastic Stack, let's look at the options that are available when running the stack.
Running the Elastic Stack
The Elastic Stack can be orchestrated and deployed in several different ways, depending on the following:
- Whether you want to manage the infrastructure that Elasticsearch will run on yourself (or if you have strict regulatory or compliance requirements requiring the use of on-premises infrastructure)
- Whether you want to have access to automated orchestration and deployment features
- Whether you need to run your deployment on specific hardware types (on-premises or in the cloud)
- The number of nodes in your Elasticsearch cluster (and therefore the scale of the compute infrastructure you need to manage)
- The number of different Elasticsearch clusters you'd like to consume within your organization
The following diagram illustrates the different orchestration options available and what level of management is provided:

Figure 1.5 – Orchestration options available for the Elastic Stack
Standalone deployments
Standalone deployments run on your own infrastructure and must be managed by you. In this book, we will run our code and examples on a standalone deployment of the Elastic Stack. These will run the same on the Elastic Cloud options.
As standalone deployments do not come with out-of-the-box orchestration capabilities, they can be difficult to manage and upgrade, especially at scale. Teams will often need to invest in custom tooling or automation to manage such deployments.
You might consider using Elastic Cloud for large production deployments that will benefit from orchestration and management capabilities.
Elastic Cloud
Elastic Cloud is an offering that provides orchestration, administration, and management functionality for Elastic Stack components. There are three products available under the broader Elastic Cloud offering:
- Elasticsearch Service (ESS) is a managed Software-as-a-Service (SaaS) offering that provides Elasticsearch and Kibana deployments for a range of cloud providers and regions of your choosing.
- Elastic Cloud Enterprise (ECE) provides orchestration capabilities for Elastic Stack components on your infrastructure (on-premises or your public cloud subnet/VPC). ECE is a Platform-as-a-Service (PaaS) product; it is self-managed in that you need to provision your own infrastructure, as well as ensuring ECE components are functional.
- Elastic Cloud on Kubernetes (ECK) is another PaaS offering that allows Elasticsearch deployments to be orchestrated on Kubernetes. ECK offers a Kubernetes operator that can deploy, upgrade, and alter Elasticsearch, Kibana, and Beats components using configuration files.
Now that we know how we can orchestrate an Elastic Stack deployment, let's look at what kind of solutions we can run on the stack.
Solutions built on the stack
As described previously, the Elastic Stack provides access to core components for search, visualization, and ingestion. These components can be used to solve a wide array of data-related problems, and it was up to the users of the products to create these solutions in the past. Over the last couple of releases, Elastic has moved to provide more out-of-the-box solutions built on top of the core components of the stack. Elastic provides solutions for Enterprise Search-, Security-, and Observability-related use cases at the time of writing. Users are free to build on top of the solutions on offer or build their own solutions for other use cases.
Enterprise Search
The Enterprise Search offering by Elastic provides access to an array of features to make it as easy and seamless as possible to add search functionality for your application, website, or workplace. Let's take a look:
- The App Search product provides access to user-friendly APIs for developers to index and search through data, with an emphasis on relevant, tolerant, and insightful searches. Relevance improves the overall quality of the results that the user sees. Being tolerant of typos and providing result suggestions makes it easy for users to use the search application itself.
- The Site Search product makes it easy for you to add search to your public website. Site Search is a SaaS service that comes with a web crawler for discovering and indexing your web-facing content. The Site Search APIs can then be used to power your search functionality. You can either implement your own frontend to integrate with the APIs or use one of the sample frontend applications provided.
- The Workplace Search product makes it easy and convenient for you to make your organizational content searchable. This can include sources such as email, instant messaging, document sharing and collaboration tools, customer relationship management platforms, and code collaboration platforms. Performing unified searches across disparate internal data sources can help improve team productivity and efficiency.
Security
The Security offering from Elastic builds on top of the solid foundation of the big data search, exploration, and visualization capabilities Kibana has offered for a long time. Elastic Security offers features for implementing security analytics capabilities using a SIEM solution, as well as EDR capabilities:
- The SIEM product enables security analysts and practitioners to easily analyze and visualize data. SIEM comes with threat hunting and investigation tools, as well as a framework for implementing threat detections and responding to alerts. The SIEM app leverages ECS, allowing it to work with all types of data, from the Elastic Endpoint Security agent to Beats collecting data from various sources, to your own ECS-compliant data sources.
- The Endpoint Security product is an agent-based malware detection, prevention, and response capability that protects hosts across your network from attacks. Endpoint Security also provides visibility into the environment by collecting host-based telemetry for visualization and more complex analytics on Elasticsearch and the SIEM app.
Observability
The Observability solution provides features that help developers and engineers gain better visibility and insight into the performance and operation of their applications and infrastructure.
The observability solution is comprised of the Logs, Metrics, Uptime, and APM apps on Kibana:
- The Logs app displays application events such as trace/info/error logs, which can indicate issues in your application or platform.
- The Metrics app puts the measurements that have been obtained from the application or its components in graphs to help the engineer understand the workload it is running.
- The Uptime app visualizes service or endpoint uptime and latency metrics to help engineers spot issues with application availability or health.
- The APM app allows you to instrument custom application code as it runs so that you can collect data on aspects such as slow functions/sub-routines and usage patterns that can lead to degrading performance or application crashes.
Summary
In this chapter, we gained a high-level overview of the Elastic Stack and its core components. We understood the role each component plays and how they can be used together to solve complex data-related problems. We also looked at what each of these components is inherently good at doing, and where they might not best serve the problem at hand. Finally, we looked at the out-of-the-box solutions in the areas of Enterprise Search, Security, and Observability that are offered by the stack.
In the next chapter, we will look at a range of options for installing and running components of the Elastic Stack to help you get started with your use cases.