


The Beginning – The Flow of Data
Data is the new gold of the 21st century, but what is it? Why is it important? Why should you know what data is and what you can do with it? More than ever, it’s important to have data and make decisions based on that data. Everyone uses information every day.
In this chapter, we’ll find out what data is, where it comes from, and how it’s used to make decisions today. We’ll also explain what data literacy is and why it’s so important for both our everyday lives and our business lives. We’ll show you some real-world examples and help you understand the basics of making decisions based on data or Data-Informed Decision Making (DIDM).
By the end of this chapter, you’ll recognize the most important parts of data and how we use it in our daily lives and at work. This will be explained with examples from the COVID-19 pandemic and stories from our own work lives.
In this chapter, we will cover the following topics:
- Understanding data in our daily lives
- Analyzing data
- An introduction to data literacy
- The organizational data flow
Understanding data in our daily lives
Data is a collection of observations or facts. Everything starts with data, and it’s all around us. We know that every person on the planet creates 1.7 MB of data every second. Yet, many people are not even aware of all the data around them in their daily lives.
When we talk to people in our everyday lives, they always say, We don’t work with data. We know nothing at all about data. But, let’s look at the facts: data is all around us in the form of numbers, words, pictures, videos, maps, audio files, sensors, music, our phones, and even our wearable devices such as smartwatches and so on. Everything around us gives off data, and we don’t even realize it most of the time. To give you an example, let’s have a look at what kind of data we use when we wake up, as we show in Figure 1.1.

Figure 1.1 – Data in our daily lives
Let’s think about this in terms of how we usually go about our workdays. We set an alarm, which is usually on our phones. When we pick up our phones, we create a movement, or event, and turn off the alarm. One of the next steps is to check the news and social media for information about the pandemic. This will help us get ready for the day to come. We’ll also check the weather to see what it looks like and make sure we’re wearing the right clothes for the day. We say good morning to Alexa or our Google home smart devices, and maybe we have a fancy coffeemaker that makes us a nice cup of coffee on its own. We might even be able to turn on the lights with an app on our phones. During coffee and breakfast, we check the traffic to decide whether to drive to work or take the bus or train.
Well, all these things or events are data. In fact, we have created a flow of data and don’t even know it, and the story goes on: on the way to work, we can use our phones to check all kinds of things (we are connected to the world). Your social media followers on LinkedIn or Twitter; it’s always fun to see how many people like your posts or replies. Let’s be honest, when a message we post on LinkedIn gets more than 100 likes or has been seen more than 5,000 times, we get excited. When we like something, read an article, or share something on social media, we give information to the companies that make the social media software.
Analyzing data
In the process of making decisions, everyone now uses data. Let’s look at an example for your next trip to Barcelona, which is a beautiful city in Spain. If you want to plan a summer trip to Spain and need a place to stay, you might look on Airbnb for a cool place to stay and set some parameters (called filters in the world of data and analytics).
Let’s see what these filters, or parameters, are:
- The dates of our vacation period
- The number of people that are joining you
- Select a super host (we mostly do this because we have some experience)
- The area that you want to go to
- The type of accommodation
- Maybe even some special things that you want (swimming pool, air conditioning, and so on)
The following is a screenshot of Airbnb and how we set our filters to find a place to stay in Barcelona, for example:
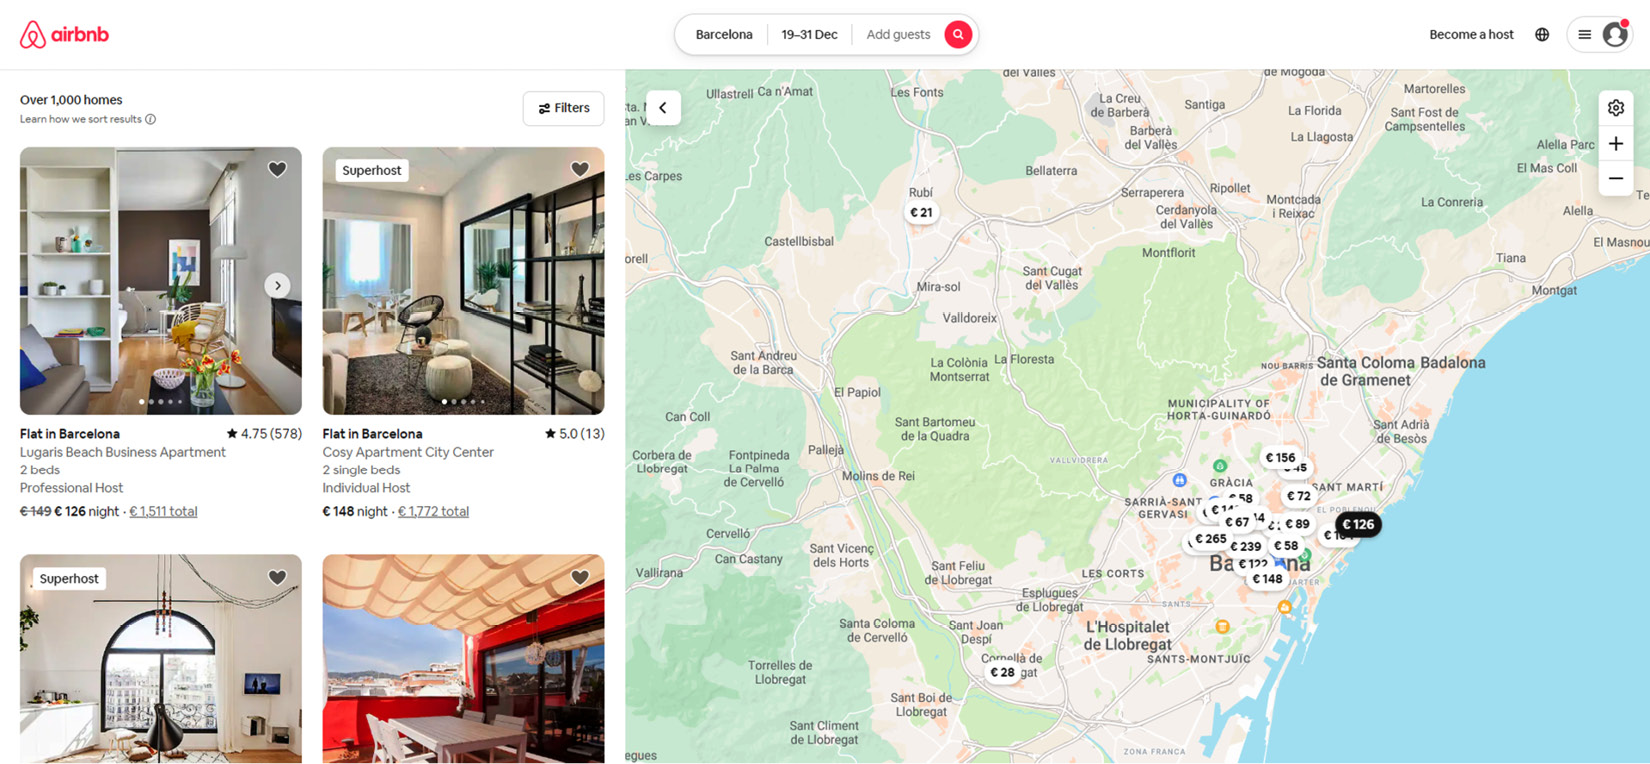
Figure 1.2 – DIDM for the summer vacation using Airbnb
When the list has a lot of places you could go to, you might want to put the ones with the best prices or most reviews at the top, as shown in the following screenshot:
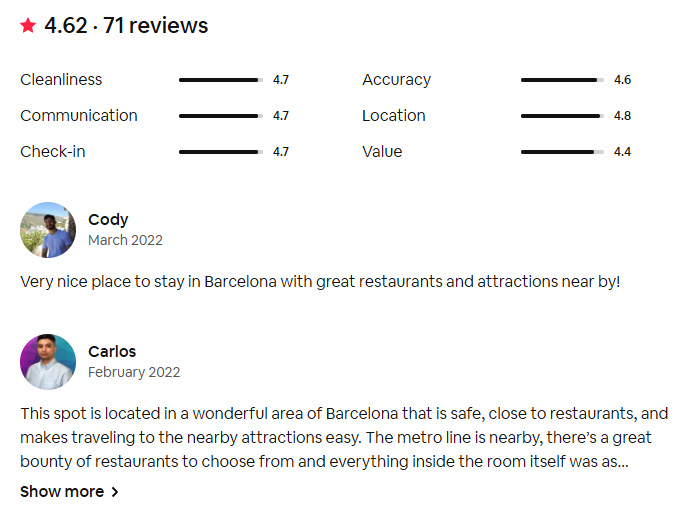
Figure 1.3 – DIDM reviews to make a choice
From there, we’ll read and think about some reviews, which will tell us a lot about the place we want to stay at. We will book a place to stay for our upcoming trip from there. In this case, we looked at data, sorted it, read about it, talked about it with the family, argued about it, and then decided where to stay during our vacation.
In this example, we’ve used data and the information that we found during our investigation (analysis) and created a decision together on where to go. In our line of work, we call this a data-informed decision.
To clarify the difference between data and information, data exists of data elements, and information is created from that data and put in context. We can’t perceive anything from data unless we give meaning to that data. When we look at information, that is not the case.
Searching and finding information
First, we’ll take a look at intentional or purposeful searching. Let’s go over some of the things we’ve talked about in the first part. We noticed that we could answer some questions with a purpose and some answers we found by accident, or as we say, unintentionally. When we wake up, one of our first thoughts is mostly set on, What should I wear today? So, we checked the weather. This was done to answer the question, What should I wear today? The other question we were trying to answer with the data was about our upcoming trip to Barcelona, Spain. Our question, Where should I stay in Barcelona? has been answered, and we’re going to a nice place with lots of good reviews and a price we can afford. Those two questions had a purpose, a goal, and we were able to decide what to wear today and we found a cool place to stay.
Reading our social media messages on Twitter or other social media platforms, the news, and stories about the pandemic gives us information that has no purpose; we were just scrolling and reading without any purpose or meaning. We could also look at ads for clothes or other shopping items without meaning to. Those actions are unintentional; there is no underlying specific question that we want to answer.
This is where data literacy comes in. Everyone on earth has some data literacy skills, even if they don’t know it. We all work with data, even if we don’t know it.
Let’s look at some of the apps we use every day to see what we mean. These apps use certain algorithms (using smart logic) to help organizations give us just the information they think we might be interested in:
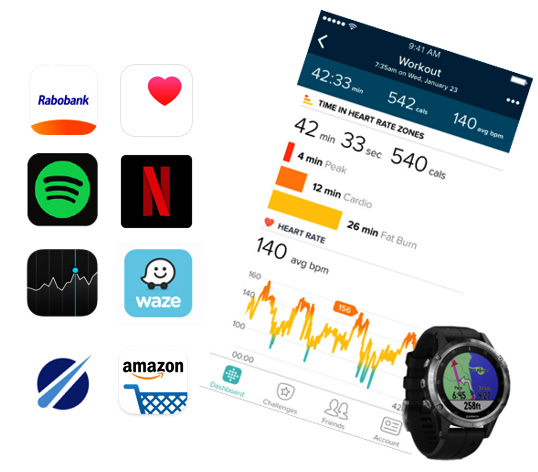
Figure 1.4 – How we use data during our days
Most of us use data and analytics every day in our personal lives. Here are some examples:
- Personal health data: The health app collects data about your health from your iPhone, Apple Watch, and other apps you already use. This way, you can see all your progress in one place. Health apps keep track of how far you walk, run, and how many steps you take. And if you have an Apple Watch, it keeps track of your activity data automatically.
- Financial transactions: A bank can tell you where you spend your money, but they can also use simple algorithms to check your credit card for any unusual charges. When a transaction is made and they think it might be a fraud because of their smart algorithms, they immediately block your credit card and send you a message telling you that someone tried to use your credit card in a fraudulent way. Also, don’t forget that on the stock market, people buy and sell stocks by using information gathered from data.
- Amazon: When you shop on Amazon, it shows you products that it thinks you’ll be interested in based on a lot of complicated math. As an example, when we ordered a whiteboard, two suggestions about whiteboard markers and a special wiper for cleaning the whiteboard popped up on our screens right away. All of this was done because we asked for a whiteboard as our first order.
- Spotify: It is used all over the world and it knows exactly what kind of music you like and gives you a list of your most played songs at the end of every year. It can even tell you what to listen to next and invite you to new podcasts based on what you’ve listened to in the past, among other things.
- Netflix: It has more than 203.67 million subscribers around the world. Since it started, it have become the most popular platform for streaming content. It grew even more than usual during the COVID-19 pandemic.
How did it become so successful? It used sophisticated data and analytics, which helped in many ways, such as:
- It was able to give users personalized suggestions for movies and TV shows
- It was able to figure out how popular new content would be before it was approved (or not)
- It could make marketing content such as trailers and thumbnail images to make the user experience more personal
- It was able to improve its own production planning in-house
- And, of course, it was able to improve business and technical decision making in general
- Your Garmin watch: The Garmin watch tells us how many steps we’ve taken (we experience it as a significant motivator to reach the 10K steps every day). Even though they say it’s not 100% accurate, our nights of sleep are tracked. We can see when we’re in REM sleep, when we’re awake, or when we’re sleeping in a light state. It also keeps track of our heart rate, how many times we climbed stairs (or mountains), and so on. It gives us a full picture of what we do 24 hours a day, including our stress level, heart rate, and how we do sports, in a fancy way.
When we use it with an app such as My Fitness Pal, for example, we can link our data with the food we eat during the day, as shown in the following Figure 1.5:
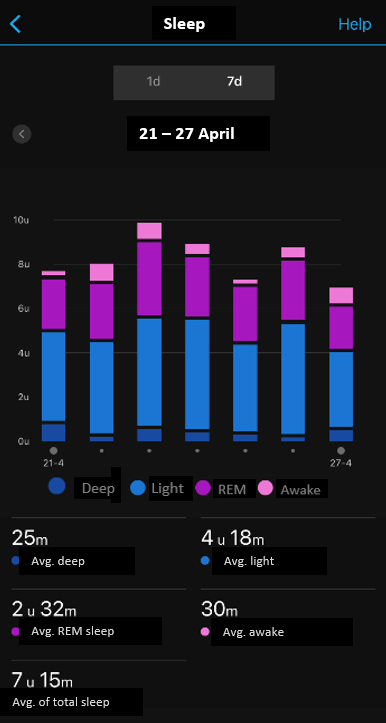
Figure 1.5 – Tracking your sleep
As you can see, all the activities that are measured serve a purpose, such as shopping, keeping an eye on our health, listening to our favorite music (and making playlists that we can share), and last but not least, watching movies and TV shows that we like. In Chapter 9, Handling Data Responsibly, we will talk about how we work with data, what you need to watch out for, and the risks that can happen when we share our own data.
Then, we get unintentional data use unintentionally. We use platforms such as Facebook, Instagram, LinkedIn, and Twitter to share news about our work or even our personal lives. We love that people are reading, liking, and even sharing our messages. Let’s be honest, we get excited when people like something we’ve written.
However, reading the news through different apps on our devices (iPad, tablet, or laptop) to stay up to date on what’s going on in the world is also an unintentional way we use data, especially since the COVID-19 pandemic hit us in 2020.
What does this intentional and unintentional data use mean? And how does it pertain to data literacy? Is data literacy the same for everyone? Well to be honest that depends what your role is within the Data and Analytics field of work. For a data analyst it would mean understanding the data related to a certain process, or transactional system, the tools that an organization uses and so on. For a data scientist, it would mean understanding the algorithms and data that is needed to create their models. For a marketing professional or a company that wants to grow, it is again different. The marketeer needs to understand how to read the created information from the data used from the website, social media platforms, and so on. But for someone who wants to take a vacation in Spain, the information they need is completely different. So, it depends on the role, the position that you are in when it comes to the understanding and level of Data Literacy.
An introduction to data literacy
So what is data literacy, and what does it mean to know how to use data? If we type data literacy into Google’s search box, we will get a lot of results.

Figure 1.6 – Google search for data literacy
We and others think that the definition of data literacy is: The ability to work with, analyze & argue with data…
From our point of view, we’d like to add that it means how a person uses data and understands the world around him (or her). It’s also a matter of behavior, that people can work with data not because they must, but because they want to!
In his article The Art of Questioning, Kevin Hanegan explains the vital role questions play in data literacy:
“Asking the right questions of your data and knowing what you want to find is a key part of getting insights from your data that lead to specific actions.”
Data isn’t just black and white; you can do a lot with it. So, two people who look at the same data can come to very different conclusions. This is because a lot depends on the problem you’re trying to solve and how you go about solving it. This is where communication comes in as a key soft skill. For that decision-making process, we need both technical skills (hard skills) and soft skills such as collaboration, organizational sensitivity, communication, and so on.
We’ll use the pandemic, the news, the data, and the choices we and others had to make as examples in the next section and the later chapters.
The COVID-19 pandemic
To start learning about data literacy, we could look at some examples we’ve gathered from the news and different government organizations around the world.

|
When we look at the headlines in this picture, we might be surprised to see that only 2,000 of the 550,000 NHS workers were tested. And the headline next to it: “As two more brave doctors die, the same headline tells a story that only 0.16% of NHS staff have been tested for the virus and that the testing station is empty.” At first, we were all scared about what was going on in our world. There was no information about the topic, and there were no tests available. We saw every day, sad and horrifying news and stories told of people dying and being taken to the hospital, and that hospitals were full of people suffering from COVID-19. |
Figure 1.7 – COVID-19 headlines
If we read those headlines without questioning them, it paints a scary picture. But what if you asked questions such as:
- Why are these numbers like this?
- What does being tested mean?
- What is a positive or a negative test?
- What does the 0.16% mean?
- Compared with what?
- Can I trust this message?
- Which sources did they use? And so on.
All of this is based on the idea that we need to think carefully about what we think and how we should act on that. When we look at some news stories about the COVID-19 pandemic, we can see that there are many kinds of articles. Some are loud (with big headlines) and others are written in a calm way. It depends on which newspaper you read.
A basic understanding of data literacy
We’ll walk through how to read a news story so we can start to understand how to use data to better understand the world around us. In this made-up example, we see how we can interact with data when we read the news online or in a paper news magazine.
Note that this news article is a mix of fact and fiction.

Figure 1.8 – News article about the COVID-19 pandemic
From what we can see and read, this article seems to be written for a wide range of people. If you look a little closer, the article also has data elements. These facts and figures can be hard to understand, and someone who doesn’t have the right skills to do so might miss some important points in this news story. They might get the news wrong, and some people might even be scared by what they read. In all honesty, the same thing has happened all over the world. Most likely, everyone who reads this kind of article could have some questions such as:
- Am I safe?
- Should I stay in my house and not go outside?
- Shall I order my groceries online?
- Can I visit my mom and dad?
- Shall we invite people to our houses or not? And so on.
If we take out the information such as the figures we see in this news story, it might make more sense.

Figure 1.9 – News article removing data elements
We would understand more if we read the news article carefully and paid more attention to the facts.
We can read that the “new positive cases are increasing.” But as stated in the article, that “could be the result of the expansion of test locations.” We can draw the first conclusion that the increase in people who tested positive could be the result of expanding the test capacity.
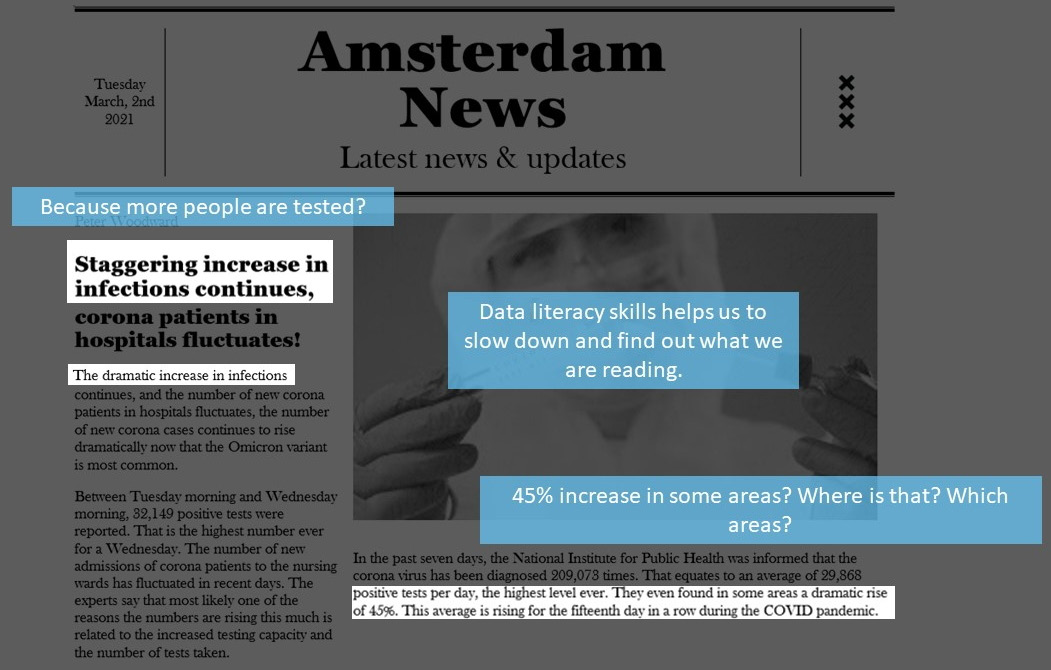
Figure 1.10 – Questioning the news article to understand the message better.
But there’s more to read in this article. If we keep reading, we’ll see that there’s more clutter and noise. Let’s talk about the mess and noise in the next section.
Removing emotions and asking questions
Some of the things in the article being shown are emotional. Words such as staggering, dramatic, dramatically, and highest level ever can make us feel scared, but they also make us biased. By being able to get rid of these parts, we can read the article again and get rid of the clutter and feelings.
Most of the time, we start by coming up with questions and then looking for answers (or feedback) that will help us make decisions. Knowing which data is useful for answering our questions is also an important part of our data literacy skills. In this situation, we could ask things such as the following:
- How does the pandemic affect me?
- Can I go and visit my parents or my family?
- What do I have to take care of?
- Will our business survive?
- What are some areas and is this here in my hometown?
- What is a test, and what does being positive or negative mean? And so on.
As questions are an amazingly important aspect of our data literacy skill set, you will find more information in Chapter 8, Questioning the Data.
We use and see a lot of data in our everyday lives. Everyone needs to know how to read and understand data. Even during a pandemic and while reading the news, we need to be able to tell what information is useful and what is not. This is what we call critical thinking. Critical thinking is part of data literacy; it is the ability to question the logic of arguments or assumptions and examine evidence in order to determine whether a claim is true, false, or uncertain. In Chapter 8, Questioning the Data, we talk more about questioning. When COVID-19 hit us, at first, we mostly felt fear, hopelessness, and uncertainty, and we had many questions. As soon as the first cases came in, the first people were taken to the hospital or even the ICU. During the pandemic, we realized that we really needed to understand what data was and how we could use it to decide what to do or how to respond to the crisis. During this global crisis, we felt like we had to find out what was going on right away.
We needed to know and understand what was going on around the world. For example, we needed to know how many tests were being done, how many people were losing their jobs, and so on.
During the crisis, it was hard because some people also gave us false information. Some said all sorts of things that didn’t make sense. In the following figure, you can see a picture that our friend Joe Warbington took of his TV.
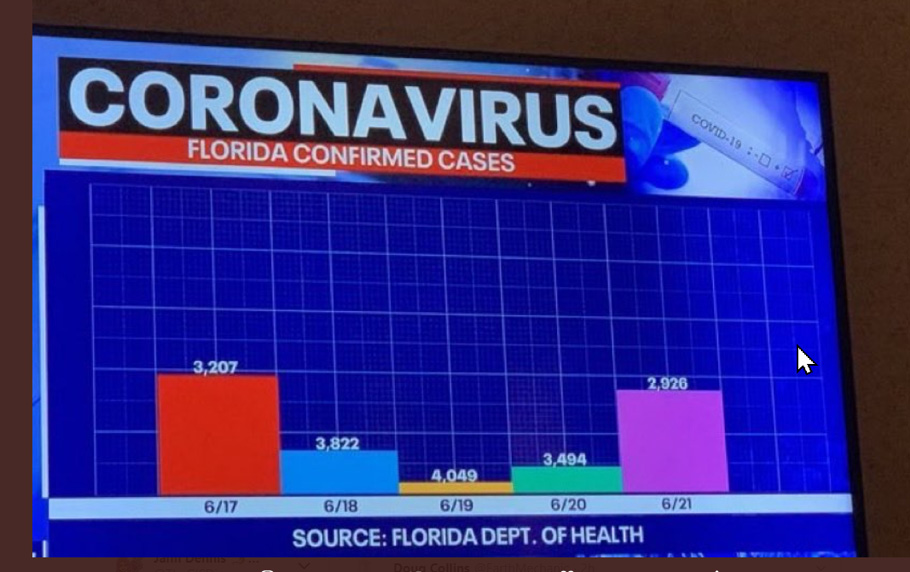
Figure 1.11 – Misleading graphs on TV
You may have noticed that the graph is a little strange, with high numbers and a small bar and low numbers and a bigger bar. We don’t see any other information or context on the axes. People take the graph for granted instead of being critical and asking questions, which is a worry.
Noticing the problems with the graph and identifying that there are things wrong with it are an important part of your data literacy skills.
From here, we can learn the basics of data and how we can use it in our daily lives. Organizations also need data, and they need to know how to use data and be literate in data. So, let’s look at the organizational data flow next to better understand this.
The organizational data flow
All beginnings are hard, and this is equally true when a company wants to start with data-informed decision making (DIDM). There are sometimes reports that give a general idea of how well the organization is doing financially. People often think, We have some Excel reports, that’s enough. But when reality hits, they realize they need more information (for example, not only information about financial matters).
When new data projects start or new plans are made to add more information to existing reports, the projects take too long, the people who wrote the hard macros are no longer available, or the project methods are no longer good. With a big bang scenario, projects will take too long and more parts will be added as the project goes on. This is called scope creep.
Another common way organizations limit the effectiveness of their data is when business users in organizations just use the numbers on the Key Performance Indicators (KPI) reports as they are. In Chapter 6, Aligning with Organizational Goals, we help you understand the KPIs and how they should align with the strategic objectives. These business users do things such as hear, see, and be quiet. They seem to think, Oh no, that’s too bad. Let’s hope the numbers are better tomorrow, next week, or next month. To be honest, this is still a very serious problem in organizations. Most of the time, it’s because business users can’t make decisions that are based on facts. Many times, it is even worse when we don’t know how to answer business questions even when we are in business and can’t make a decision as simple as how to read graphs and reports or how to analyze. Still, it’s important to keep track of your organization’s goals and help people understand the insights that can be drawn from data. This will help them make decisions based on the data and not get lost in the data-insights jungle.
As mentioned at the beginning of this chapter, we have so much data in this digital age. Our data mountain is growing every day (1.7 MB per second per person on this planet), and data can help us be successful in what we do. So, we need to look at how information moves through an organization and what kind of knowledge and processes need to be taken care of. The following diagram represents a visualization of how the data grows, covering the flow of data and which disciplines are involved.
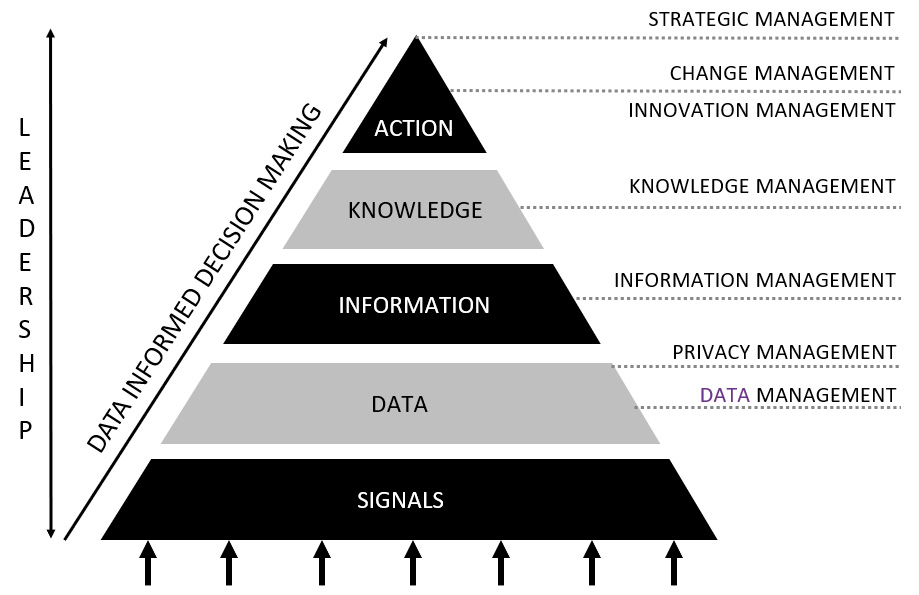
Figure 1.12 – The flow of data
If we look at how data-informed decision making works, we can see that it all starts with signals. There are a lot of signals around us right now. These signals are turned into data, and then that data becomes information (something we can do something with), and finally, knowledge. We’ll use the following simple example of a traffic light to show how this works:
- Signal: We are receiving light waves in our eyes.
- Data: The data that we receive or see is that the light is red.
- Information: The information that we have is that we know it’s a traffic light.
- Knowledge: The knowledge that we have is that we know we must stop.
- Action: The action is that we will stop in front of the traffic light as we don’t want to have an accident or get fined for passing the red traffic light.
One thing that can hinder the ideal flow of data in an organization is where data is stored and how it is managed. Data is kept in many places, for example, POS systems, CRM systems, and Excel documents, which keep track of sales data, marketing data, and financial data respectively. Multiple source systems are usually not a problem in smaller organizations, but in larger ones, they could be a problem and a potential risk.
When organizations don’t pay attention to data management for simple things, such as different types of addresses or different definitions of fields, this could cause problems in how data flows through the organization. Data governance needs a place as well within your processes when we think of the usage of data. Do not confuse data governance with data management. Data management is about the day-to-day business when we use data in a company, whereas data governance looks at how the company can make more money using data in the future. The earlier Figure 1.12 shows the different disciplines that an organization could use to set up a data and analytics environment, not just from a technical point of view, but also from a business point of view. To ensure data is managed effectively, businesses need the right skills and processes in place:
- Data management: Businesses deal with a lot of data. That data needs to be managed well so everyone can use it effectively. It is necessary to take care of things such as data entry, data registers, data quality, and so on. Today, we call this the data office, and a chief data officer usually runs it.
- Privacy management: Keeping personal, customer, or proprietary information safe and secure is vital. Privacy laws exist in many countries, covering things such as the right way to handle data. Most of the time, a data protection officer takes care of this. Later in this book, there will be more about privacy and how to handle data in an ethical and secure way.
- Information management: Information management is an important part of turning data into the insights that are needed. There are many ways to describe information management, but we think this is the best one: information management is the process that ensures that the information needs arising from various processes of an organization are translated into insights necessary for measuring and achieving the organizational objectives.
- Knowledge management: Businesses need to manage their information and knowledge effectively to avoid wasting people’s time searching for the right information. Too much knowledge is stored in our (collective) brains, so we need to register and collect knowledge and plan for the future.
On a small side note, some organizations in the Netherlands have a staff with an average age of 48. That means that information about processes, systems, designs, and other things needs to be kept for the future.
- Change management: Change management is a systemic approach to dealing with changes in a business. Every new dashboard, report, or change to an existing dashboard or report is overall a change, and we need to help the management and business stakeholders accept the change and work with the new dashboards and reports. There is more in this book about this subject.
- Strategic management: Strategic management is how an organization manages and achieves its overall goals. Data and analytics need to be embraced by the management or board of directors, and they need to set an example for the whole staff. If the people in charge don’t take part in data and analytics projects, the idea will fail.
As you read through this book, there may be many concepts that are new to you. We’ll help you gain a better understanding through case studies, such as the next one.
Intermezzo 1 – Is data management necessary?
This first story is from an organization that has a lot of complex systems. This organization wanted to set up a new source system for their registrations. Moreover, it was necessary to build connections between other systems. Of course, one of them was the connection to the data warehouse system.
Because no data management or data governance was in place, or no register for data elements was available in conversations that were held about common things such as how we arrange the connections, which protocols we need, and so on.
It would have been much better if we would have talked about the definition of attributes, formats of date fields, or other elementary data fields.
In fact (and this is something we say a lot during lectures and presentations), we all should speak the same data language! When one source system is in a different language than another system, we will run into problems when we want to extract data (or even connect data) or use data for dashboards and reports. You will get into problems if data management or data governance is not in place.
P.S. All the stories that are written in this book are real-life stories, and out of respect for the organizations, we will sometimes not mention any names.
The DIDM journey
Anyway, if we have data and are willing to use any tool, and we want to work with it, the data becomes information. Information management is an important part of the process because of this. In the end, information will become knowledge if we are willing to take in the information and go on that journey to understand the insights. The ideal flow of data or data journey will eventually look like this:
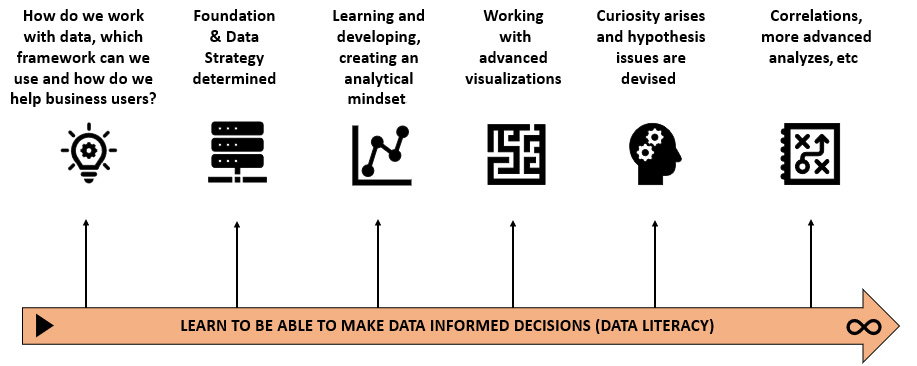
Figure 1.13 – The data-informed decision-making journey
The hardest part is to act on and make decisions based on what you’ve learned. This happens a lot in the places where we work or have worked. As we’ve already said, when the insights are actionable but we forget to deal with the change or forget to put them into action in our projects, we tend to take the insights for granted.
But how do you move forward? You can do this by analyzing the insights in small steps and slowly learning that data literacy and taking action go hand in hand.
In this book, we’ll show you how to work with data, how to read and evaluate insights (be critical and ask questions), and how to make decisions based on what you learn. You must go on a journey, which starts with figuring out your (data) strategy, working with that data and gaining insights, and eventually starting to think about hypothetical questions and using more complex ways to show data. Put that dot on the horizon, start small, and grow quickly.
In the next section, we’ll tell the story of The Oakland A’s who did a great job of using data and analytics.
The success story of The Oakland A’s
Let’s go through the success story of The Oakland A’s where we describe their journey when they started working with data-informed decision making. This story is a true, real-life story and they even created a movie about this success story, named Moneyball.
|
|
Billy Beane, general manager of the Oakland Athletics, is devastated by the team’s loss to the New York Yankees in the 2001 American League Division Series. Some of the star players left the team and Beane needed to assemble a new competitive team for the 2002 competition with a limited budget. During a scouting visit to the Cleveland Indians, Beane meets Peter Brand, a young Yale economics graduate with some amazing ideas about evaluating players. Using Brand’s method, Beane signed up undervalued players and traded another player. |

Figure 1.14 – The Oakland A’s
People are biased, and one of the things said in the movie was about Chad Bradford, who is one of the best pitchers. Bradford was not chosen by any big team, but with the analysis that Brand performed, they found out that he was highly underestimated; why? Because he threw the ball in a funny way (as they say in the movie, because he throws funny). Based on the analysis, they hired Bradford and he became a successful player for the team. This is a big reason why we’re telling this story. He didn’t get picked because of bias. But if you looked at his batting scores, he did well, so he was one of the most undervalued players.
The scouts for the Athletics didn’t like the plan Beane had made, and in the end, Beane fired the head scout. Beane stuck with the new plan, and even though they lost the first 10 games, critics wrote of the new way of working with data.
As Brand says, math and statistics get rid of bias, and to be successful, you need to get things back to one number (one fact, one measure). They traded some players again, and then the team started to win.
The Athletics broke a record by winning 20 games in a row. Hatteberg’s walk-off home run helped them do this. Beane tells Brand that he won’t be happy until they win the World Series with their system and change baseball.
Fun fact
Billy Beane has helped a Dutch soccer team improve its statistical approach and use data to make decisions about players. He even bought some shares in the Dutch soccer team AZ Alkmaar.
Summary
After reading this chapter, we know more about data literacy and how we can use it in our everyday lives. With this skill set, we can do a better job of responding to the things we read and see around us, such as the pandemic; it also helps us decide how to respond in these conditions. We used an example to talk about how to get rid of noise, mess, and feelings.
Then, we talked about how data moves through an organization and which disciplines should be looked at. We talked about how these different fields can help make data and analytics projects successful.
We ended with a story about a baseball team in the United States. You learned that they became a successful team by using data, letting the insights speak for themselves, and taking bias out of decision making.
In the next chapter, we’ll talk about the journey an organization can take. In practice, a journey doesn’t always go as planned. Most of the time, we start with plain business intelligence (or performance management), but some organizations start with data science or advanced analytics. The problem is that these kinds of organizations don’t even measure how well they’re meeting their goals.